Distillate production back in favor, but will it reverse again before the winter is over?
As you may recall, I wrote about distillate pricing relative to gasoline (a large determinant of refining operating strategy) a couple months back. At that time, we had finally seen gasoline start to lift away from diesel as relentless inventory builds were only staved off by huge floating storage positions being taken out.
Since then, we have seen a series of consistent distillate draws, which combined with good news on the Covid-19 vaccine front, as well as a perceived cool winter outlook for the more populated areas of the nation has led to some confidence building in distillates once again. While the strength in distillates is not uncommon in the winter, I would still question the fundamentals behind this pricing action. Let us examine some possible drivers.
Will winter weather drive higher heating oil demand?
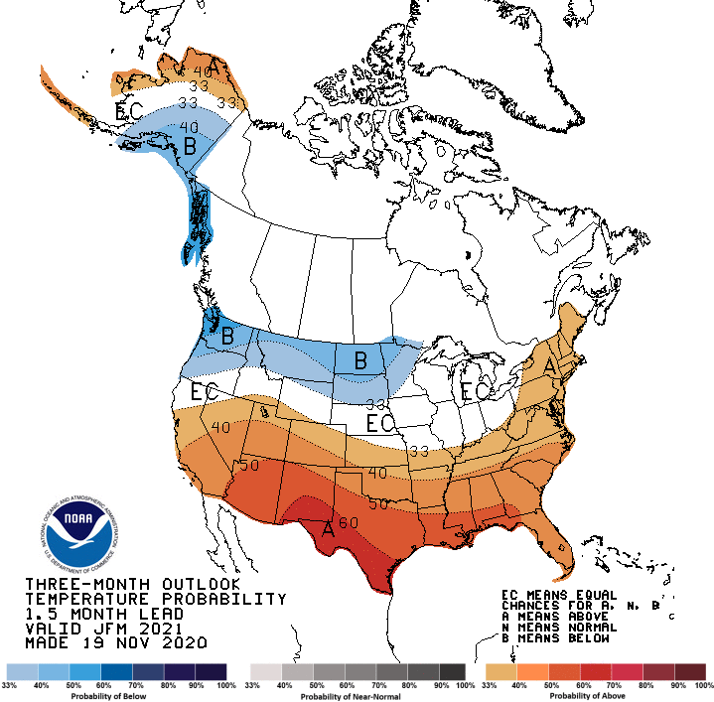
Figure 1: A cold winter…NOAA climate prediction center doesn’t think so…
Figure 1 shows the long-range forecast (Jan-Feb-Mar 2021) for the winter. With a moderate La-Nina at play, we are seeing above-normal conditions forecast for most of the major population centers in the US, especially ones that consume Heating Oil (Northeast). This to me kind of suggests nothing exciting in the weather-induced demand area for distillates.
What about a resurgence in Air Travel?
There is currently a well-recognized surge in Covid-19 in the US and additional restrictions/lockdowns have been forthcoming. I would not expect demand in this area to be anywhere near normal until there is a significant amount of vaccination or other decrease in infections. Based on TSA data, passenger volumes are still at only about 34% of this time last year (based on most recent full week).
Well, inventories are drafting…
So they are. We did see a draft of about 36.7 million barrels between September 11th and November 20th, which was a substantial help and did get inventories back within the 5-year band as Figure 2 below shows. We should temper this just a bit though and remember that days of supply are still quite high at 36.
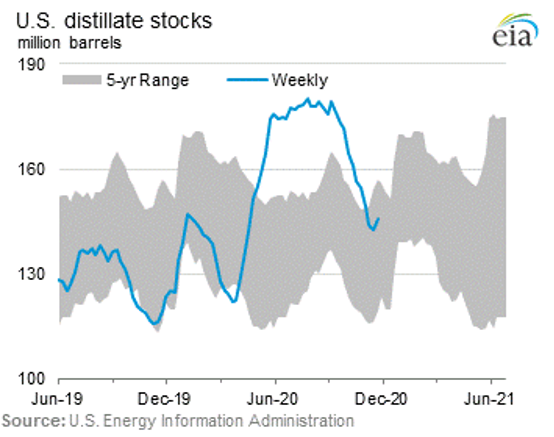
Figure 2: Distillate inventories vs. the 5-yr range. Source: EIA.
It is difficult for me to put my hands on the data to show that some of the draft in stocks was due to the loading of the VLCCs which I discussed in my previous blog, but I have a suspicious feeling that it was a contributor (at least 1/3 of it if not more). It would be typical to see a draft in the fall with harvest demand in the Midwest, but maybe not one as steep as this draw that we saw.
Let us take a look at how things have unfolded for the Gasoline – Distillate spread (G-D) shown in Figure 3 as the NYH RBOB less Heating Oil spread. I have labeled a few points which I would like to discuss on the event timeline, the top chart is the G-D spread and the bottom chart is the weekly distillate inventory delta (both from the EIA).
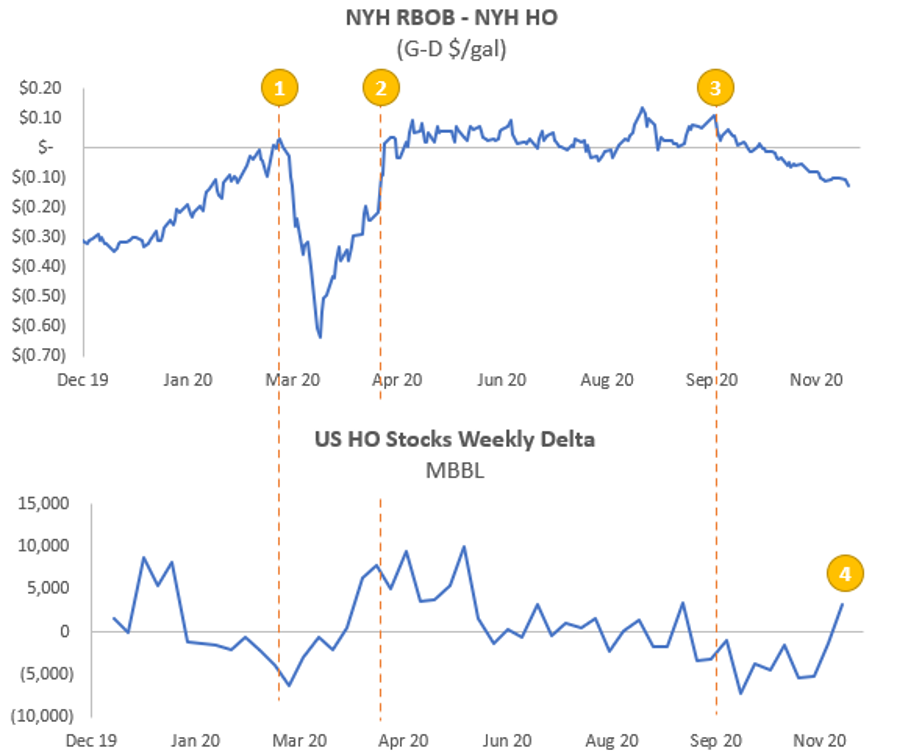
Figure 3: First chart – New York Harbor (NYH) RBOB gasoline less NYH Heating Oil (HO) front month contract. Second chart – weekly heating oil stocks change from previous week. Source: EIA.
Up to point 1 it was business as usual – the G-D spread did narrow out of the distillate favorable regime as we came into the typical higher gasoline demand season, but then Covid-19 hit…hard. Between points 1 and 2 the markets tried to find their feet, and while gasoline crashed, for a moment, distillate seemed to hold up, becoming extremely favorable. At the bottom of that “V” I called that this was a bit ridiculous considering the sudden plummet in Jet/Kero demand (most of which would find its way to the ULSD pool). Sure enough, the market gained some sanity and we saw G-D come closer to parity at point 2 as refiners balanced to the “new normal.”
Between points 2 and 3 I would call it the pandemic steady-state. Refiners adjusted runs to more economic regions as overproducing became financially punitive and product pools started to become relatively balanced, even drafting on the gasoline side. During this period, I was surprised we really did not see G-D go more towards gasoline.
A little before point 3 we got the news of traders loading VLCCs of ULSD for export/floating storage and harvest season kicked off in the Midwest. Which while quaint sounding, is a serious demand driver and you can see it in inventories and demand for sure. All those trucks, tractors, and combines are thirsty for diesel. Inventories drafted nicely between point 3 and 4, driving G-D towards diesel.
Additionally, news of progress in vaccines started rolling in, fueling a general rally in the hydrocarbon complex as traders hopes of a strong economic recovery were stoked. Also, remember ULSD is typically highly correlated with GDP, so an economic recovery should be fueled by diesel (and Jet too).
Now we find ourselves at point 4, which presents an inventory build, and a lot of not-too-good Covid-19 news. Price action continues to point to even more favorable distillate production, but one again a fear this may be a bit over-blown. Either way, the distillate-favorable spread has certainly boosted conversion and crude distillation incentives compared to the period between 2 and 3.
Whether or not this price trend is sustainable, refiners must be nimble and respond quickly to these market changes. There is money to be made as the spreads change and every lost minute resisting change or holding steady can represent lost margin.
For more information, visit imubit.com
Recent Posts

Jun 30, 2025