
With tight natural gas supplies globally, expect to see energy and carbon optimization become more significant in plant optimization
After taking a month’s holiday from the blog, we are back this month with what has probably been the biggest change in the market – natural gas. It would appear that the age of cheap energy is at least taking a break if not ending as demand outstrips supply for natural gas globally. Supplies in the US have only barely kept up with LNG feed gas demand, leaving the US net balanced to slightly short. This is exemplified by the price action seen below in the NYMEX natural gas futures trend. We are seeing gas prices that have not been seen for years in North America.
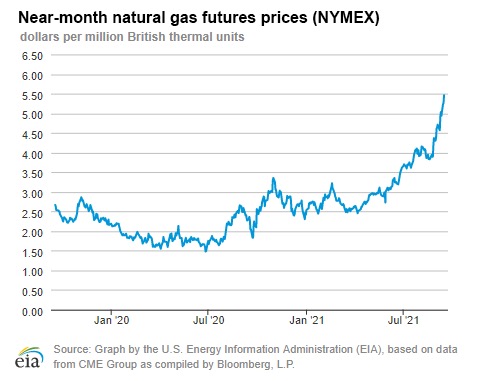
Figure 1: NYMEX natural gas futures, near-month, as shown in last week’s EIA natural gas weekly.
This trend is also global as we have seen low inventories in Europe, leading to the Dutch TTF marker trading near $20/MMBTU and similar levels for the Platts Japan/Korea Marker (JKM) price. At those kinds of prices, energy really starts to become a factor in plant optimization. Burning that extra BTU to get the last bit of fractionation may not play out favorably at this point depending on the prices and equipment.
Carbon Credits are adding to energy costs for EU hydrocarbon processors
In addition to record or near-record gas prices in EU, hydrocarbon processors are also seeing higher carbon costs, with the cost to emit one tonne of CO2 up 50% since March.
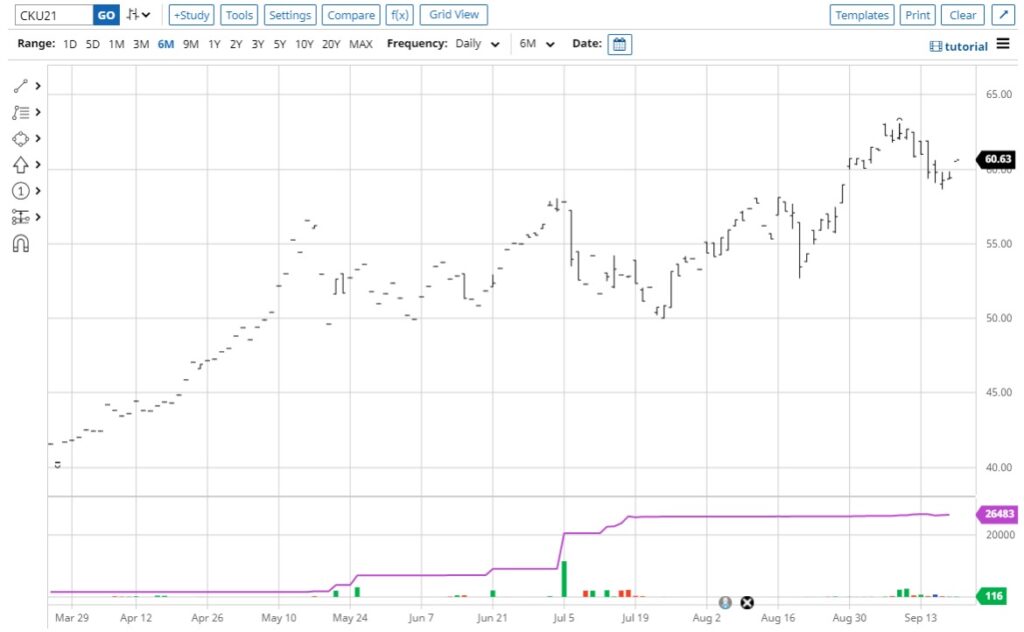
Figure 2: ICE EUA futures for Sept 2021, European Union cost of carbon has trended from EUR 42 to EUR 63/MT. (US$49-74/MT). Source: Barchart interactive chart for CKU21.
This makes simply switching to a cheaper fuel that is more carbon intensive less of an option, since the carbon penalty for higher C:H fuels ends up increasing their total cost. In the table below, we attempt to estimate what those costs might look like with the cost of carbon at US$75/MT (EUR 63/MT).
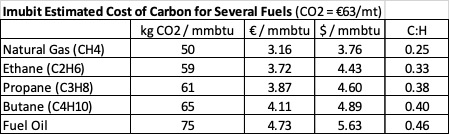
Figure 3: Imubit calculated EU carbon cost by fuel gas component.
While energy optimization in processes will start to become more relevant in the US at $5/mmbtu, the real showstopper here is the total cost of energy in regions that incrementally import LNG like Asia and Europe/UK. Given the EU cost of carbon on top of gas cost, total costs in EU come to ~$24/mmbtu. Managing energy usage and optimizing it against yield and throughput will be critical for European operators.
Imubit’s Closed-Loop Neural Network platform can help to optimize these non-linear trade-offs of energy intensity vs. yield and throughput in real-time using up to date market pricing. This could be particularly interesting when it is possible to burn hydrogen or introduce other fuel components with different carbon emissions intensity. Let us help you navigate your journey towards optimizing your facility’s energy intensity.
For more information, visit imubit.com
Recent Posts

Jun 30, 2025