

US Refiners See High Crack Spreads, but Renewable Fuel Credits Eat into Actual Profits
Recently we have seen some buzz about refining crack spreads being at favorable levels. While this appears to be true on the surface, a key component of understanding actual domestic fuels production profitability is the current value of the Renewable Volume Obligation (RVO). The RVO can be quite significant and recently has hit new highs not yet seen. We will discuss the RVO and RINs in more detail below. First, let us start with what the typically quoted “crack spread” for diesel and gasoline are:
Crack Spread = Fuel Product Value – Crude Value
This equation is simple and easily calculated with market prices such as the wholesale price of Unleaded Regular Gasoline (ULR) or #2 Heating Oil (HO) and West Texas Intermediate (WTI) crude market value. The reality of refining is that profitability is not simply measured by the crack spread. In addition to the cost of crude, the refinery must pay its variable operating costs such as energy, catalysts, and chemicals. Additionally, the value of the product marker is not typically what can be received by the refinery for incremental production due to transportation and market demand limitations (they may need to ship a great distance to reach the incremental market). The final piece of the pie which directly subtracts away from profitability is the RVO.
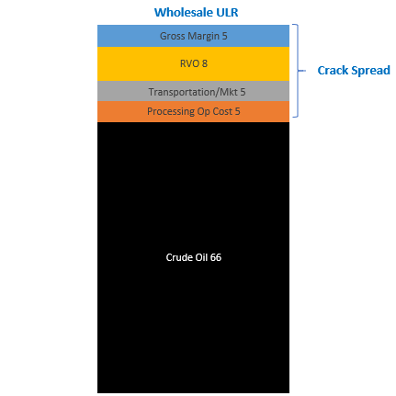
Figure 2: Illustration of RVO, transportation, and variable op costs subtracting away from the crack spread, leaving something closer to actual refinery gross margin. (Imubit Illustration)
Even the above illustration is not completely accurate as refineries are complex systems which produce many products simultaneously. Refineries can also induce volume gain through cracking processes such that crude is not directly related to gasoline and diesel in a 1:1 fashion once all of these effects are taken into account. This is why refiners use complex LP models to help determine optimal crude/product slates and unit conditions.
RVO and RINs – Why are they up?
All around us today there are signs of inflation in commodities and consumer goods caused by high demand, COVID-19 inventory drawdowns, hangovers from idled capacity, and other factors like regional droughts. Corn and Soybeans are no different in that regard. Corn is the primary feedstock to produce the D6 (ethanol) Renewable Identification Number (RIN), and Soybean Oil is the primary feedstock to produce the biodiesel (D4) RIN.
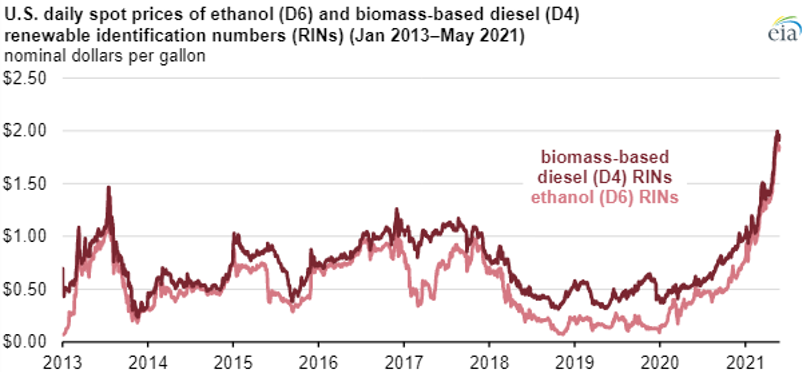
Figure 1: D4 and D6 RINs hit historical highs in May 2021 as a result of rising corn and soybean commodity prices. Source: EIA
The RVO is calculated based on a proportion of the RIN prices, including the two other more rare and pricey RINs (D3 and D5 which represent cellulosic biofuel and advanced biofuel). There is an EPA page which vaguely lays out how the RVO is calculated. This complex regulatory framework set out by the Renewable Fuels Standard (RFS) program means that I cannot simply explain to you how they are related, nor do I completely understand it. For most people, just know the RVO is related to RIN prices in a relatively linear way. For Imubit’s internally generated price sets, we use a function that is linearly related to the D4 and D6 RIN to approximate the RVO cost.
A better way to look at the crack spread – RVO Adjusted
Due to the above complexities, I think many people (including even the EIA) shy away from showing RVO adjusted crack spreads. That said, they are important in understanding whether the observed crack spread will result in refinery profits. From my team’s experience (all experienced in Planning and Economics functions at major Refining and Petrochemical companies), many refiners do internally look at RVO adjusted crack spreads in addition to the “market” crack spread that I laid out at the beginning of the article. This RVO adjustment is simply:
RVO Adjusted Crack Spread = Fuel Product Value – RVO – Crude Value
Trending this value over the last few months and using gasoline crack as an example, we notice a different trend on the RVO adjusted crack spread (green) than in the market apparent crack spread (blue) in the chart below.
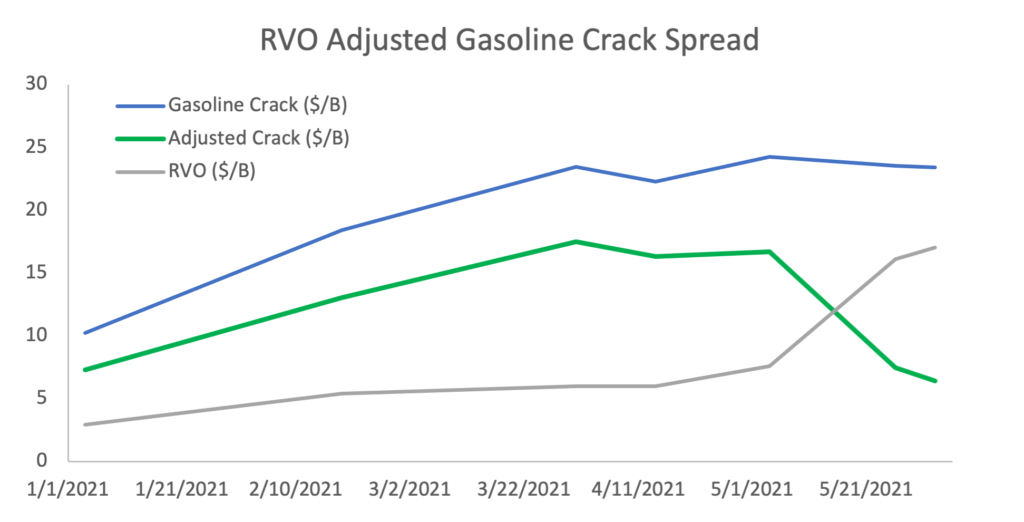
Figure 3: Imubit estimated RVO adjusted crack spread. Data from several public sources in addition to Imubit assumptions. Note the public data from the EPA on RIN prices lags the current market so the last two points were drawn from Figure 1 above.
As you can see, with the recent run-up in RINs prices, the RVO has really eaten into actual US refining profitability. The gasoline crack, while quite high, is not high enough to offset the increase in RIN cost. With stocks still drawing on diesel and gasoline, the market gasoline crack may need to rise to help offset the increased cost of compliance with the RFS federal program.
Imubit’s Closed Loop Neural Network™ technology can respond to pricing volatility on as frequent a basis as you like with no robustness concerns. With a lower adjusted crack spread, a generic signal such as “max gasoline” may not be granular enough to maximize profitability. Optimizing units based on a live objective function that reflects your site’s most important strategies every few minutes can continuously balance the many trade-offs that exist in the plant.
For more information, visit imubit.com
Recent Posts

Jun 30, 2025