.png)
Every LNG facility generates boil-off gas, but transfer and loading operations produce far more BOG than static storage—making every loading cycle a disproportionate loss event. Flaring intensities vary more than 100-fold between the best and worst performers. Traditional control systems struggle most during exactly these transients, when multiple subsystems respond independently and revert to conservative actions that shed BOG to flare. AI optimization trained on facility-specific data can forecast BOG generation before pressure excursions develop and coordinate setpoints across compressors, reliquefaction, fuel gas systems, and storage pressure control to close the gap between installed recovery capacity and realized recovery.
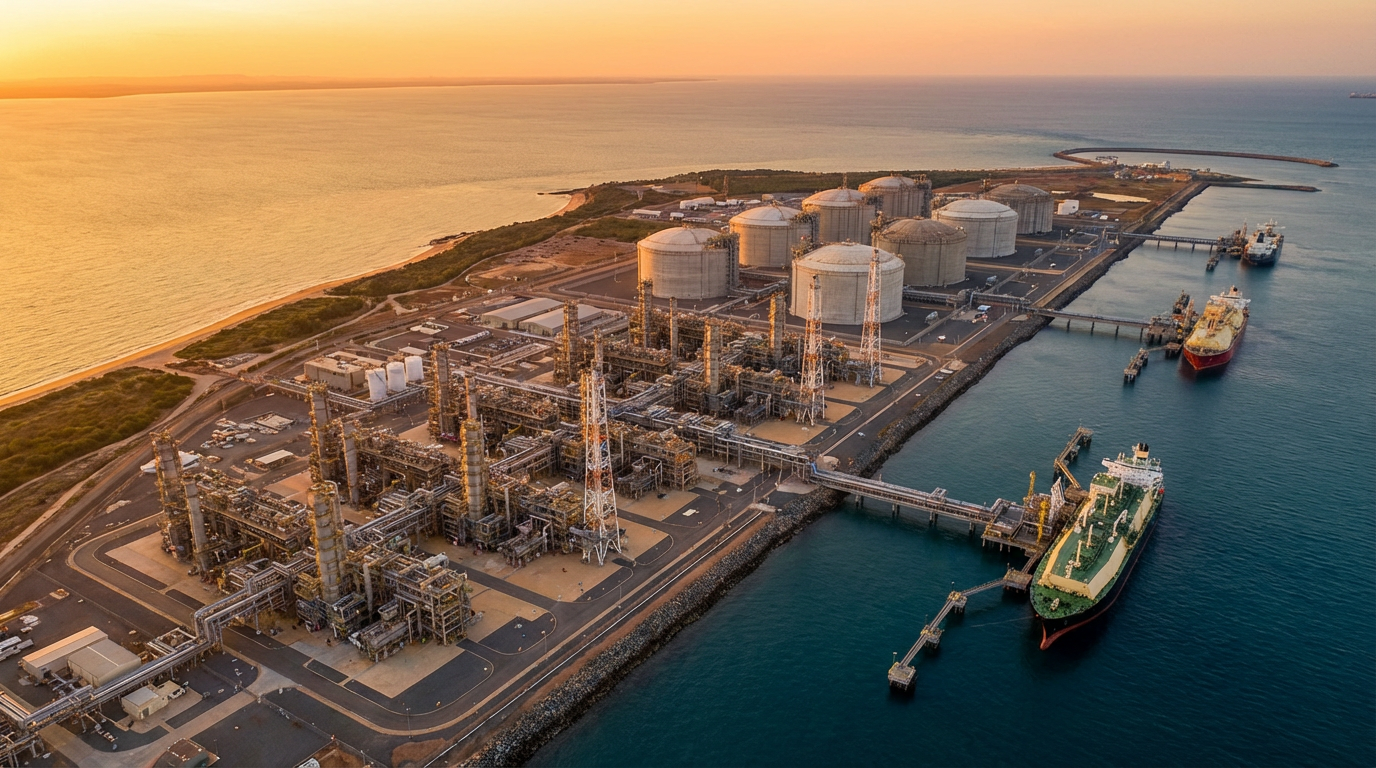
Every LNG facility lives with boil-off gas (BOG). Heat leaks through tank walls, loading operations displace vapor, and pressure transitions flash liquid to gas. The question has never been whether BOG exists, but how much product value it destroys before recovery catches up.
According to a 2025 IEA assessment, flaring intensities across LNG plants vary more than 100-fold between the best and worst performers, with some facilities losing up to 3% of output through unrecovered vapor.
As margin pressure intensifies across LNG export operations, the difference between a facility recovering BOG efficiently and one flaring excess vapor isn't a rounding error. It's a margin driver. That's why many teams are revisiting their approach to LNG plant challenges long before they sign off on new equipment.
The constraint is that BOG generation rates are anything but steady. Storage produces a predictable baseline, but transfer operations generate significantly more BOG than static storage. Traditional control systems, designed around fixed parameters, struggle most during exactly these transients.
BOG management is moving from reactive vapor handling toward coordinated, model-based approaches that recover more product during the events where losses are highest.
Each of these dynamics plays out differently depending on facility configuration, recovery infrastructure, and how well subsystems coordinate during transitions.
Transfer and loading operations create the largest BOG losses, dwarfing the predictable baseline that storage tank heat leak produces. Storage BOG depends on insulation performance, ambient conditions, and tank design. Modern composite insulation can reduce that baseline compared to traditional perlite systems, but storage BOG is manageable with standard compression.
The mechanisms are cumulative.
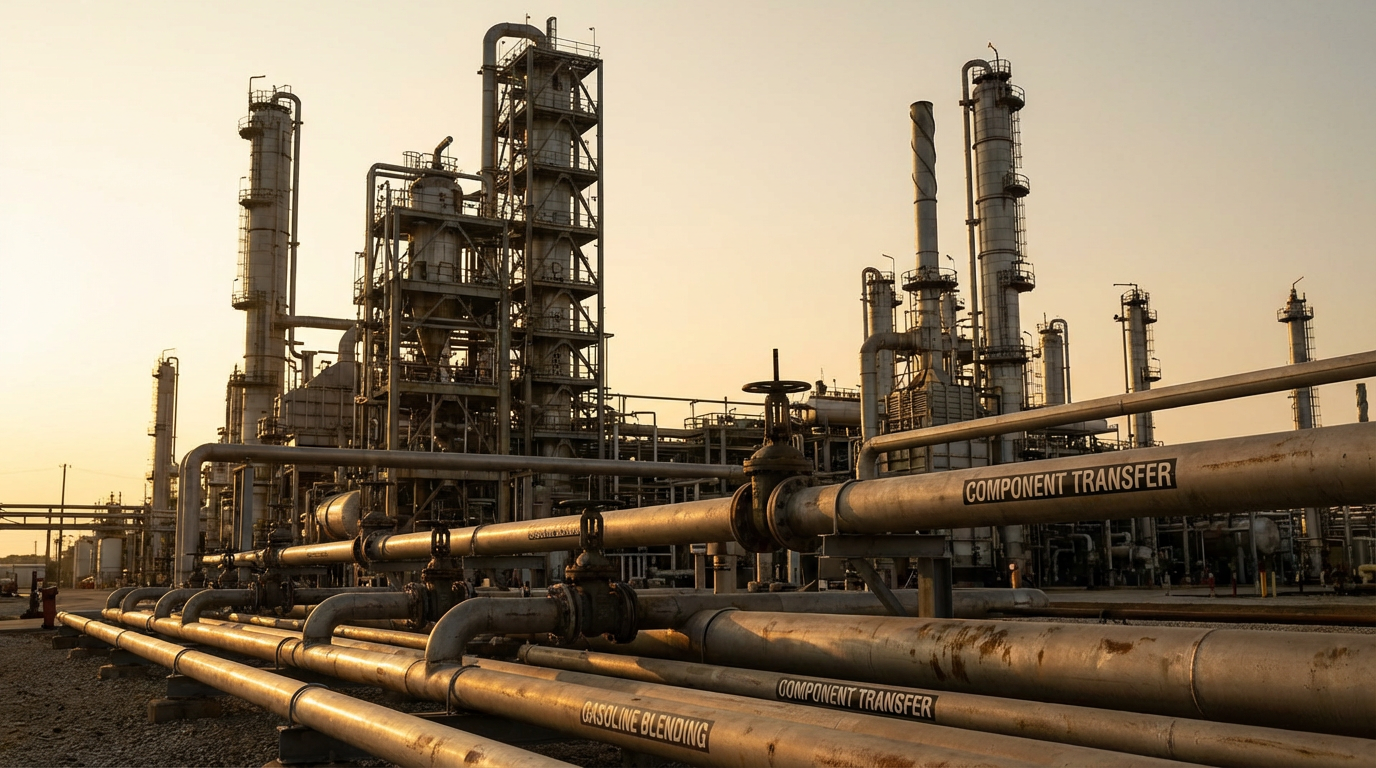
Flash gas forms during pressure drops at loading arm connections, vapor displacement fills the receiving tank's headspace, and the recirculation stage, which operators sometimes extend to keep transfer lines cold, can generate BOG that keeps climbing rather than leveling off.
BOG "losses" show up in more places than the flare stack. Even when vapor is recovered, high BOG events can drive compressor power and cycling, increase driver fuel consumption, and create knock-on constraints in downstream refrigeration and fuel gas systems.
Those costs matter because they rise right when loading schedules are tight and plant operations are already constrained.
Ship tank cool-down is often the single largest controllable waste opportunity because it's procedural, repeatable, and sensitive to pacing. When protocols repeatedly reheat tanks between spray sessions, much of the LNG used for cool-down never produces stable, cold tank conditions.
A steadier cool-down rate that avoids unnecessary warm-up cycles means less LNG wasted on reheating work that's already been done.
Operationally, the highest-loss periods tend to be the same periods where teams "buy insurance" by holding extra tank pressure headroom. That headroom reduces the risk of hitting relief limits during a transient, but it can increase flashing and vapor displacement once the transfer starts. The best-performing sites treat that trade as a controllable variable, not a fixed safety margin.
When facilities evaluate where to start, cool-down protocol optimization and energy efficiency improvements typically show returns first. Pressure control optimization and flash gas minimization often follow.
BOG recovery approaches serve different facility profiles, and no single approach fits every plant. Without active recovery, high-BOG events force a binary choice: flare the excess, or risk a pressure excursion. Both cost money.
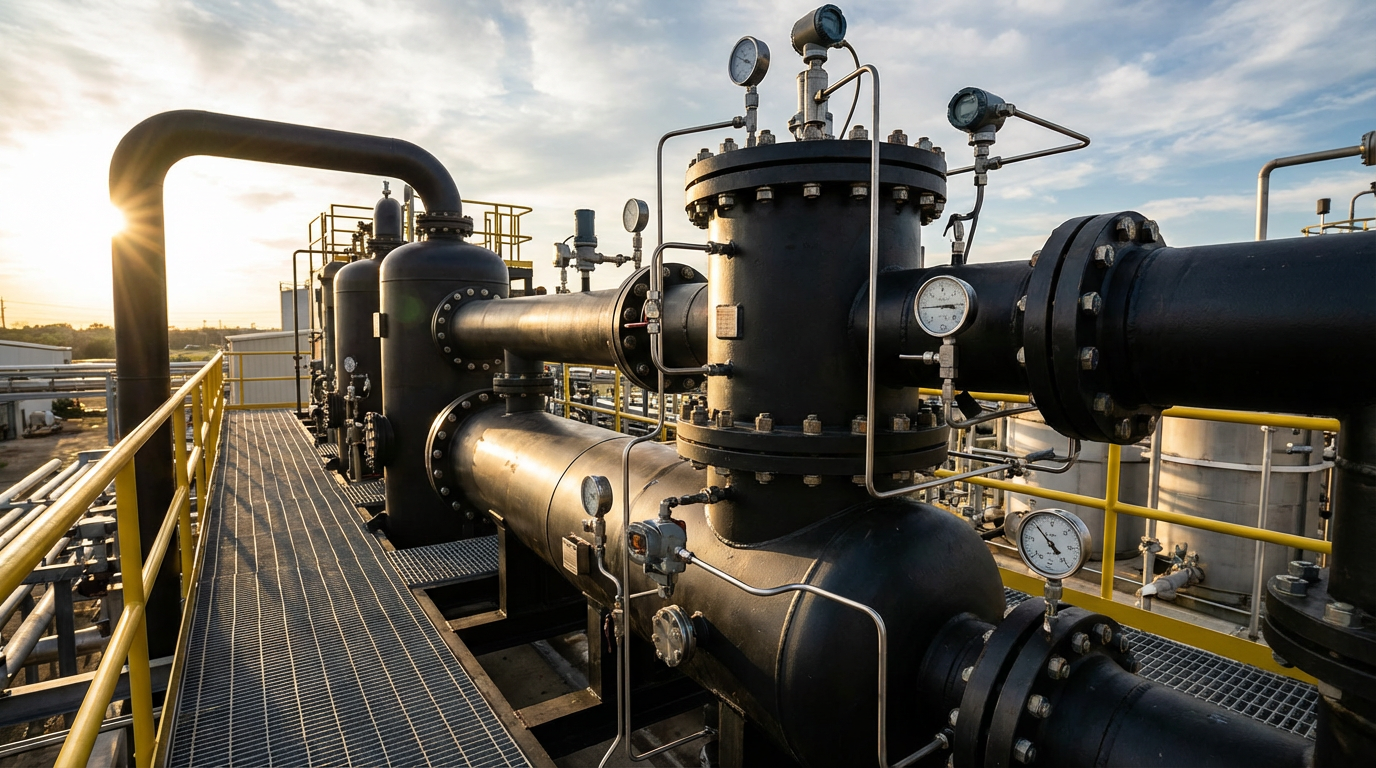
Most facilities anchor their strategy on BOG compression, using reciprocating or centrifugal compressors to capture vapor and route it to fuel gas systems or back into the process. Each machine type carries different tradeoffs around turndown, maintenance burden, and surge sensitivity, but either way the core problem is the same: BOG variability during loading events often exceeds what the compression system was tuned to handle smoothly.
In practice, many BOG "losses" start as a control decision made to protect surge margin or limit compressor cycling, not as an equipment capacity constraint.
Compressor sizing creates a related tradeoff. Designing for peak loading events reduces flaring risk, but it can push day-to-day operations into inefficient part-load regions that increase energy cost, wear, and cycling frequency. Sites that track compressor cycling alongside flared volume tend to see where plant reliability and recovery economics intersect.
Where volumes justify the capital, reliquefaction recovers full product value by returning BOG to liquid state. Newer reliquefaction designs can achieve lower specific power consumption through additional compressor staging and improved heat integration. When BOG volumes are modest or those economics are unfavorable, routing BOG to on-site fuel users can still capture BTU value, even if it doesn't recover LNG product.
Layering advanced process control onto whichever recovery configuration a facility runs can tighten BOG handling considerably. At one LNG facility, APC applied specifically to BOG handling stabilized flow back to the liquefaction process and brought down average BOG flow.
That translated into measurable improvements by reducing refrigeration system load, and the whole implementation layered onto the existing DCS without replacing it.
Installed recovery capacity rarely equals realized recovery, and the gap widens during the same high-BOG events where losses matter most.
One reason is how conventional control logic treats equipment constraints. Anti-surge protections, high discharge temperature limits, and suction drum level controls are designed to prevent equipment damage, not to maximize recovery during a transient.
When multiple protections interact simultaneously, the system tends to revert to conservative actions that keep equipment safe but shed BOG to flare. The same constraint interactions that operators manage routinely during steady state become harder to balance when boil-off gas generation rates spike and multiple subsystems respond at once.
The deeper limitation is coordination. BOG management spans compressors, reliquefaction, fuel gas systems, storage pressure control, and utilities. Even when a DCS provides a common platform for all of these, control strategies within that platform still tend to operate each loop independently.
Each controller is tuned for its own objectives. When loading rates change, tank pressure control and vapor return systems respond on different timescales, and conventional approaches resolve those mismatches by shedding load rather than finding a better operating point.
Multi-train facilities are particularly vulnerable because transitions stack up across equipment. A loading event on one train can shift BOG flows that affect compressor loading across the facility, and the control system for each train typically responds based only on its own loop variables.
The biggest losses sit in these handoffs between subsystems, where conventional control reacts locally instead of coordinating plantwide.
The coordination gaps that limit conventional recovery are, at their core, multivariate problems that span subsystems and timescales. That's where AI optimization fits.
AI models trained on facility-specific historical data can forecast BOG generation rates based on ambient conditions, feed composition, loading schedules, and equipment state. When the model identifies that an upcoming loading event will generate BOG exceeding current compressor capacity, it can adjust setpoints across multiple subsystems before the pressure excursion develops.
That shared view of the whole system changes how planning and maintenance decisions land in operations. A loading schedule shift that looks minor on paper can become a high-risk transient when a compressor is down or when a tank pressure target is already elevated.
When all parties can see the same forecast of pressure, compressor loading, and recovery margin, decisions move from "who owns the problem" to "what tradeoff is acceptable today."
Facilities deploying AI-driven plant automation on BOG systems typically start in advisory mode, where the model recommends setpoint changes and operators evaluate those recommendations against their own experience. AI optimization doesn't replace the judgment an experienced operator brings to a non-routine event.
It handles the sheer number of interacting variables that make BOG management during transitions difficult to manage manually.
For newer operators, there's a training benefit too: seeing what the AI recommended versus what actually happened builds intuition about how process control systems interact during high-BOG events. Over time, as operators validate that recommendations consistently match or improve on manual decisions, facilities can progress toward closed loop control where the AI writes setpoints directly.
For LNG operations leaders seeking to close the gap between current BOG losses and best achievable recovery rates, Imubit's Closed Loop AI Optimization solution offers a path that starts with plant-specific modeling and advisory recommendations, then progresses toward writing setpoints in real time across BOG compression, reliquefaction, and loading coordination.
The system learns from actual facility data, integrates with existing DCS and APC infrastructure, and builds operator trust before taking direct control actions. Learn more about LNG production optimization.
Get a Plant Assessment to discover how AI optimization can reduce boil-off gas losses and recover product value across your LNG facility.
Transfer and loading operations introduce multiple simultaneous generation mechanisms that storage alone does not. Flash gas forms during pressure drops at loading arm connections, flowing LNG displaces vapor in receiving tanks, and recirculation keeps lines cold but generates BOG that rises continuously. Combined, these mechanisms produce significantly more BOG than static storage rates. Tighter continuous process control of pressure and vapor handling is central to reducing losses during these events.
Yes. The most effective implementations layer AI optimization onto existing control infrastructure rather than replacing it. APC deployed on BOG systems integrates with existing DCS through model-based cascade controls, with minimal additional infrastructure. AI optimization extends this by coordinating across subsystems that APC manages independently, addressing system-level interactions that drive losses during transitions through plantwide process control.
The most operationally relevant metrics include daily boil-off rate as a percentage of stored volume, BOG generation per loading event relative to throughput, compressor utilization and cycling frequency, and the ratio of recovered versus flared vapor. The best benchmark is often a facility's own historical envelope under comparable operating modes and seasons. Tracking these over time clarifies whether broader operational efficiency efforts are sustaining improvements.