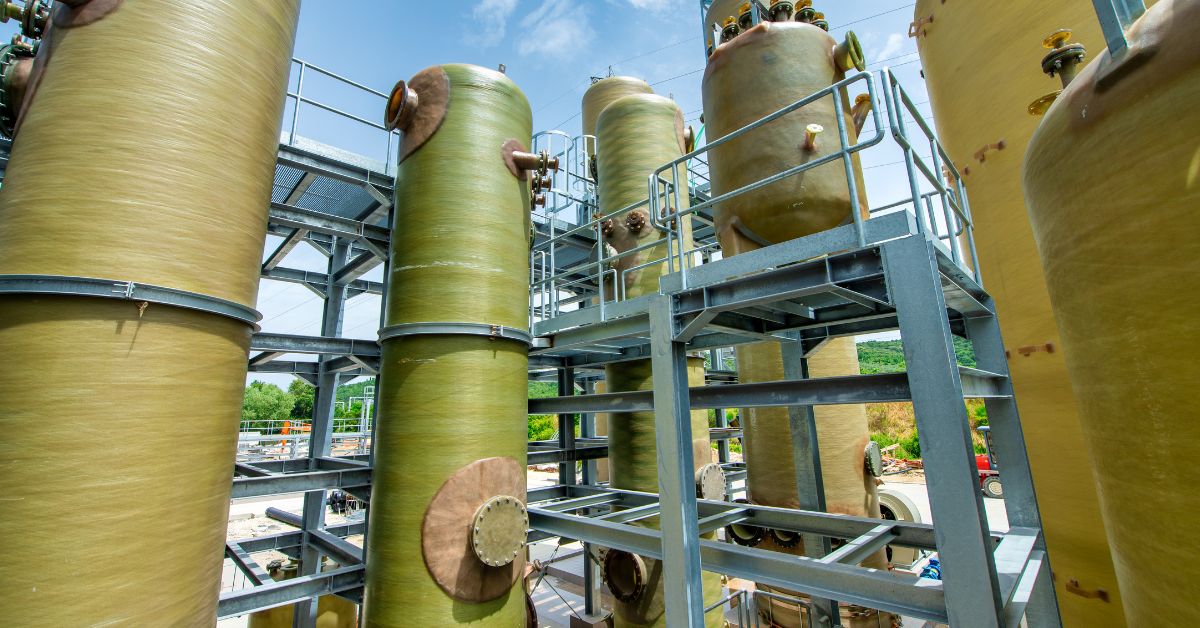
Hidden inefficiencies in process plants lead to high costs and lost production. Closed-Loop AI technology solves this by continuously learning plant behavior and writing optimal setpoints directly to control systems. This automation improves key performance indicators like equipment availability, production rate (throughput), energy consumption, quality rates (yield), and maintenance costs, ultimately boosting overall equipment effectiveness (OEE) and profitability.
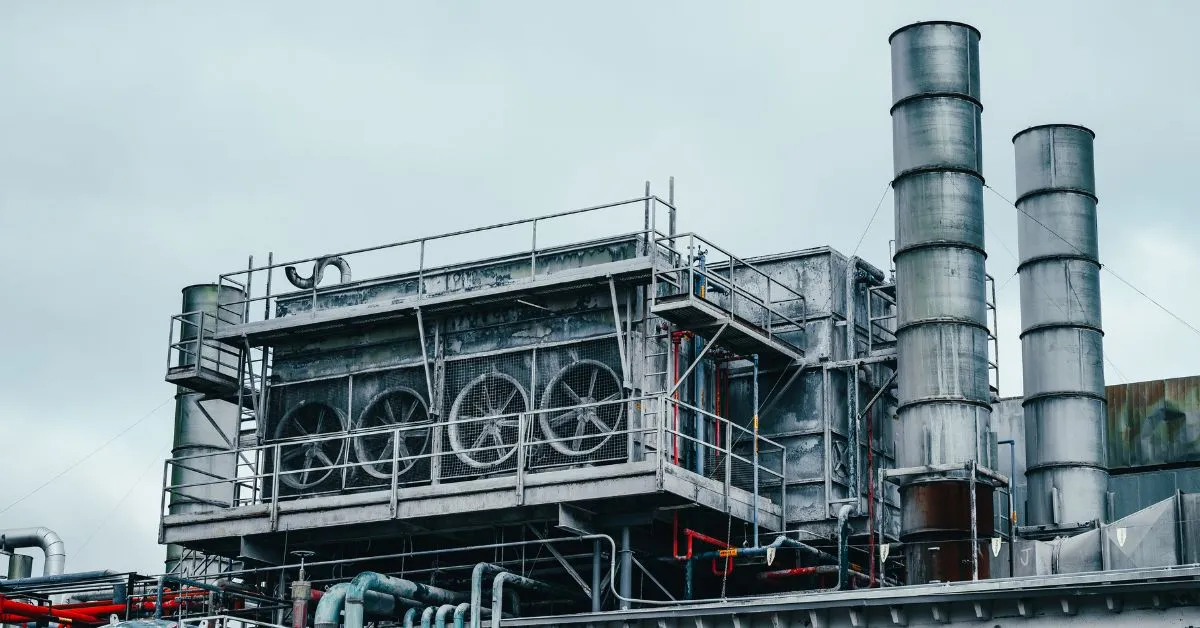
Hidden inefficiencies exist in nearly every process plant. Energy consumption often creeps above target levels in ways that manual monitoring can't detect, while overall equipment effectiveness (OEE) may stall well below expectations. The result: lost production, higher energy costs, and unplanned downtime that steadily erode margins.
It's no surprise, then, that 98% of 800 surveyed manufacturers cited cost optimization, operational efficiency, product innovation, and improved customer experience as key drivers of their digital transformation initiatives.
Closed-Loop AI helps turn those blind spots into actionable opportunities. By continuously learning your plant's unique behavior in real time and writing optimal setpoints directly to the distributed control system (DCS), it automatically guides operations toward the economic sweet spot; unlocking efficiency and profitability that manual oversight can't achieve.
Six KPIs define how well a process plant converts energy, feedstock, and labor into profitable output. AI optimization can improve all six by learning from plant data and adjusting setpoints in real time.
These six metrics form a connected scoreboard; optimizing them in coordination delivers results that isolated efforts can't match.
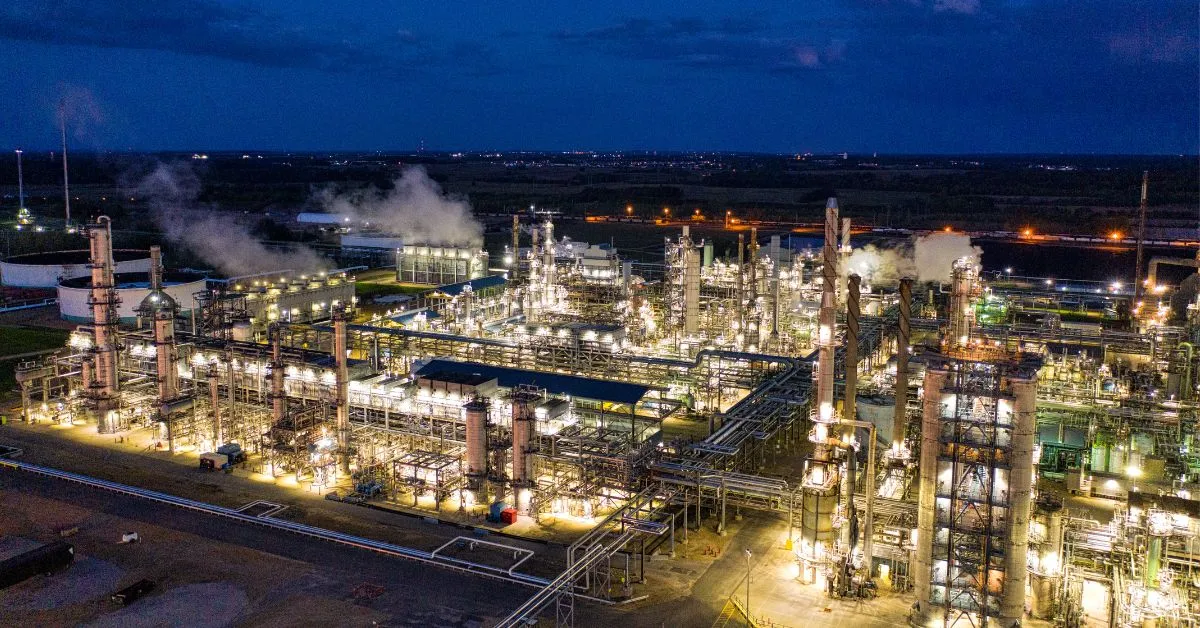
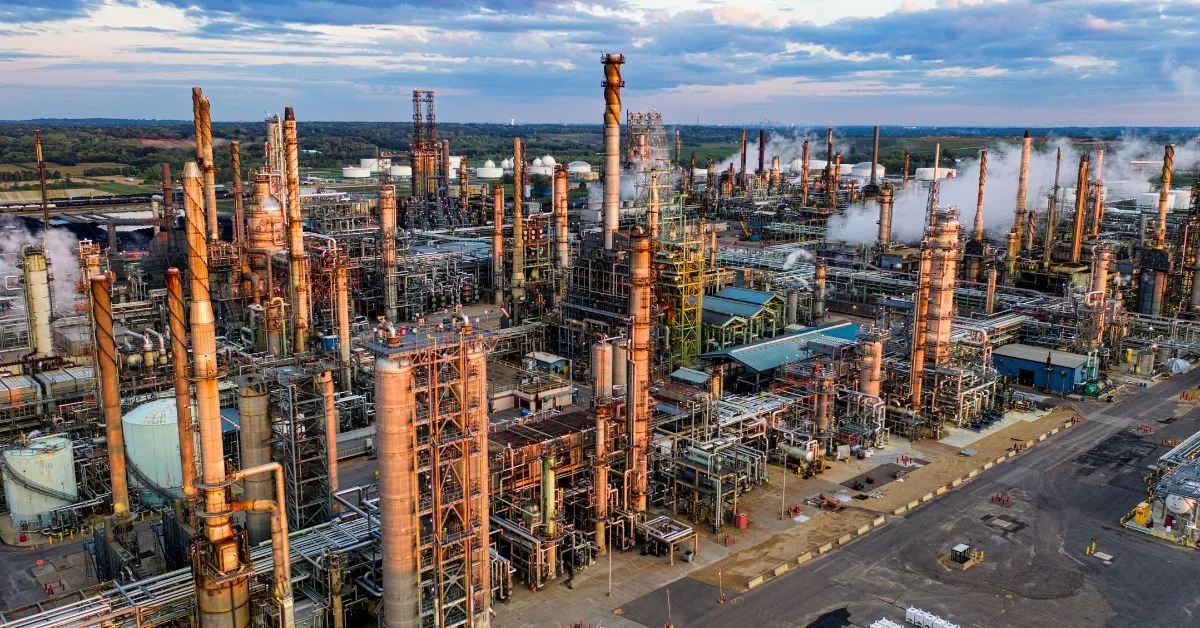
Operational efficiency in process industries means converting every unit of energy, feedstock, and labor into maximum profitable output. Tracking that transformation requires clear, real-time visibility into efficiency metrics that show how each unit performs against economic and safety constraints.
When these KPIs appear in a unified dashboard, they create one version of truth for engineering, maintenance, and finance teams. Energy cost spikes, quality giveaway, or unexpected downtime become visible immediately. Benchmarking against industry standards reveals bottlenecks like under-loaded compressors or excessive temperature cushions that waste fuel.
Data quality remains the foundation. Sensor drift, sampling gaps, or manual spreadsheets distort every calculation and derail AI programs before they deliver value. Validating historian tags, calibrating sensors, and standardizing formulas provide Closed Loop AI Optimization with the accuracy it needs. Measuring the right KPIs with reliable data becomes the essential first step toward autonomous optimization.
Equipment Availability measures how often critical assets are ready to run: Availability = (Actual Run Time ÷ Planned Production Time) × 100. Unplanned shutdowns multiply material waste, spike energy costs, and derail production targets. Surprise downtime remains the largest drain on operational efficiency across process plants.
Closed-Loop AI changes this reality. The system streams high-frequency sensor data into learning models that spot pattern shifts long before vibration levels, temperature drift, or power draw trigger conventional alarms. When an anomaly surfaces, the model coordinates alerts and writes corrective setpoints back to the distributed control system (DCS) in real time, preventing a kiln trip or compressor stall from cascading through the plant.
A few straightforward practices amplify these gains: schedule regular sensor-health checks, consolidate historian tags into an AI-driven early-warning dashboard, and benchmark current performance against asset availability best practices.
Throughput measures how much sellable product a system pushes through per hour. Any time a plant runs below nameplate capacity, fixed energy and labor costs are spread across fewer barrels or tonnes, cutting into profits. Advanced AI optimization solutions keep equipment operating at the safe edge of its power-draw or hydraulic limits, squeezing every bit of capacity out of existing assets without new capital.
The technology builds a live map of bottlenecks, then lets a reinforcement learning (RL) controller test micro-adjustments in real time. As soon as constraints shift, say, a compressor fouls or feed density changes, the model pivots, reallocating flow and temperature setpoints to sustain peak rates.
Quick wins start with a focused debottleneck study, loop-tuning audit, and a pilot AI setpoint optimizer on the unit most often throttling production.
Energy intensity, the kilowatt-hours or British thermal units you burn for every tonne of sellable product, lays bare how efficiently your plant converts fuel into revenue. It's a standard KPI across process sites, giving you a single number you can benchmark against peers and past performance.
Driving that number down pays twice: lower natural-gas or power bills today and a smaller Scope 1 footprint that shields you from tightening carbon fees. Yet intensity often drifts upward as equipment fouls, raw-material quality shifts, or operators favor quality cushions that quietly waste fuel.
Closed Loop AI keeps those forces in balance. By learning how furnace draft, feed composition, and product specs interact, the optimizer writes real-time setpoints back to the distributed control system (DCS), trimming excess firing gas without nudging you into off-spec territory.
To capture quick wins, audit heat-integration losses, convert static furnace limits into dynamic AI targets, and let an AI-driven compressor schedule smooth out load swings. The result is a leaner energy profile that strengthens both profitability and ESG credentials.
First Pass Yield, the share of product that meets specification the first time, gives you the clearest view of quality performance.
Every percentage point of off-spec material hits profit twice: once through wasted feed and again through the extra energy needed to rework or dispose of it. Giveaways, such as running a distillation column a degree hotter than necessary, quietly compound the loss by burning more fuel than the quality target requires.
Automated optimization attacks these leaks in real time. Multivariate models learn the complex interplay between temperature, residence time, and feed variability, then write optimized setpoints back to the distributed control system (DCS) every few minutes.
To capture similar improvements, pair inline analyzers with frequent sample results and stream both into the AI model. The system can reconcile lab lag, correct for sensor drift, and keep quality on spec even as raw-material grades shift, transforming yield from a retrospective KPI into a live performance dial.
Maintenance spend is easiest to compare when you normalize it, either as dollars per operating hour or as a percentage of asset replacement value. Those ratios reveal how much value slips away when crews race from one breakdown to the next. Plants that still rely on reactive repairs typically suffer longer outages and higher materials bills, a pattern highlighted in comprehensive maintenance strategies.
AI optimization solutions change this dynamic by learning normal vibration, temperature, and power-draw signatures, then flagging even slight pattern shifts long before traditional alarms activate.
Instead of waiting for a bearing to seize, the system schedules a short intervention during an existing downtime window, keeping equipment available and labor costs predictable. Because the same models can weigh production loss against repair risk in real-time, you avoid blanket calendar preventive maintenance and focus on fixes that truly move the cost needle.
The financial impact compounds quickly. Plants that pair AI-driven monitoring with disciplined planning report slimmer spare-parts inventories, fewer emergency contractor callouts, and safer work environments thanks to earlier defect detection. Even incremental gains cascade across energy, throughput, and quality KPIs because stable equipment underpins every other efficiency metric.
To start lowering maintenance costs with AI technology, establish your approach systematically:
With each cycle, the solution refines its understanding of your plant's unique wear patterns, turning maintenance from a budget wildcard into a controllable line item.
Overall Equipment Effectiveness combines three pillars—Availability, Performance, and Quality—into one yardstick of plant productivity. The math is straightforward: OEE = Availability × Performance × Quality.
The five metrics discussed earlier feed directly into OEE components. Fewer unplanned shutdowns boost availability. Higher sustainable throughput lifts performance. Tighter control of giveaway improves Quality. When these improvements happen in isolation, gains stay trapped in individual units. Closed-Loop AI makes them compound.
The plantwide optimization model analyzes thousands of data points in real time, aligning setpoints across units and writing optimal targets back to the distributed control system (DCS) every few seconds.
Plants adopting this approach often move OEE into world-class territory, delivering measurable production and energy improvements. Integrated AI dashboards keep every stakeholder focused on the same plant-wide metric, ensuring momentum builds rather than fades.
Closed-loop AI platforms function as a self-tuning layer that learns from plant data, calculates the economic optimum, and writes setpoints directly to the distributed control system (DCS) in real time.
By closing the feedback loop—rather than merely suggesting changes—these systems eliminate the latency limiting traditional advanced process control. The result is simultaneous improvement across all efficiency metrics.
For availability, dynamic simulation and anomaly detection keep assets online by identifying potential issues early. Throughput improves through reinforcement learning (RL) controllers that safely expand operating constraints. Energy optimization occurs through continuous heat-balance adjustments that reduce steam, fuel, and power demand based on current conditions.
Yield improvements come from multivariate inferentials that prevent quality giveaway, while maintenance costs decrease through pattern-shift analytics that enable proactive intervention. These gains combine to improve overall equipment effectiveness (OEE) through unified dashboards that translate individual optimizations into comprehensive plant metrics.
Implementation typically follows three phases: data preparation and historian mapping; advisory mode to benchmark benefits; and controlled transition to autonomous closed-loop operation, with operators maintaining override capability. Research on AI in manufacturing operations confirms this staged approach delivers rapid, sustainable improvements safely.
For process industry leaders looking to bring availability, throughput, energy intensity, yield, maintenance spend, and OEE under tighter control, Imubit's Closed Loop AI Optimization solution offers a data-first approach grounded in real plant operating history. The platform learns from actual process behavior and writes optimal setpoints directly to the DCS in real time. Plants can start in advisory mode, where the model benchmarks performance and surfaces hidden improvement opportunities, then progress toward closed loop optimization as operator confidence builds.
Get a Plant Assessment to discover how AI optimization can improve your plant's efficiency metrics.
Start with the metric that has the most direct impact on margin. For many process plants, energy intensity offers a fast return because fuel and power costs are large, visible line items with clear baselines. Equipment availability is another strong starting point if unplanned downtime is a recurring issue. The key is mapping each metric to its data sources and confirming that sensor and historian infrastructure is reliable enough to support AI optimization.
Initial results on a single metric, such as energy intensity or throughput, can appear within weeks of deploying an AI optimization model on a targeted unit. Compounding improvements across all six metrics takes longer because the system needs time to learn interactions between units and constraints. Plants that begin with a focused pilot deployment and expand incrementally tend to build sustainable, plant-wide results.
Yes. AI optimization layers on top of existing DCS and APC infrastructure rather than replacing it. The model reads process data from existing historians and writes setpoints back through the same control architecture already in place. This means plants can improve OEE by coordinating production efficiency across availability, performance, and quality without a controls migration or major capital investment.